

- the interactive video solution for e-commerce
By including and activating the customer already in a campaigns initial touchpoint, Codemill's flagship product Smart Video engages the crowd from the start. The direct outcome is more leads and the long-term win is a brand that will be remembered.
UX and service design / Smart Video / Spring 2018
- challenge
To design a tool that gives the user enough freedom to be creative and build their own shoppable videos, without risking a bad end resultat due to bad poor cofigurations. To make something complicated seem simple.
The custom made wordmark.
- solution
The solution is an evolvement of the interactive video product Smart Video and designed for companies in need of Smart Video as a service. With Smart Video’s technology and main idea as a foundation, the final concept can be seen as a premium service built to streamline the experience for the three user groups; developers, operators and customers.

Components of Smart Video's shoppable video. The video player, the card bar and the product cards.
" What we do is that we inspire our customers by showing them a Smart Video that is made up by their own logotypes, content and products, to make them go; ‘god, this is so good’. And then, let’s say it takes us ten days to design a native advertising campaign, the actual video doesn’t have to be delivered until day ten. Customer
" When it comes to the video you receive, I would like to see some kind of feedback section. That they could comment on it in connection to the demo. For them to point out stuff they would like to change or if there are product switches that needs to be done. Like ‘can you fix this?’. Developer
" I mean it can turn out to anything. Not everybody has the knowledge to modify CSS and therefore it might be good to set boundaries. Although, it might be possible for them to decide on themes for the player itself, if someone is looking for that option in the future. Operator
The identified customer journey.
- component focus group
One of the key elements of the service is the action of creating a new project, meaning that the user has to provide the operators with the data they need to produce the shoppable video. As there are many possible ways to upload this data, key stakeholders were collected to discuss what components that are best suited as upload interactions.
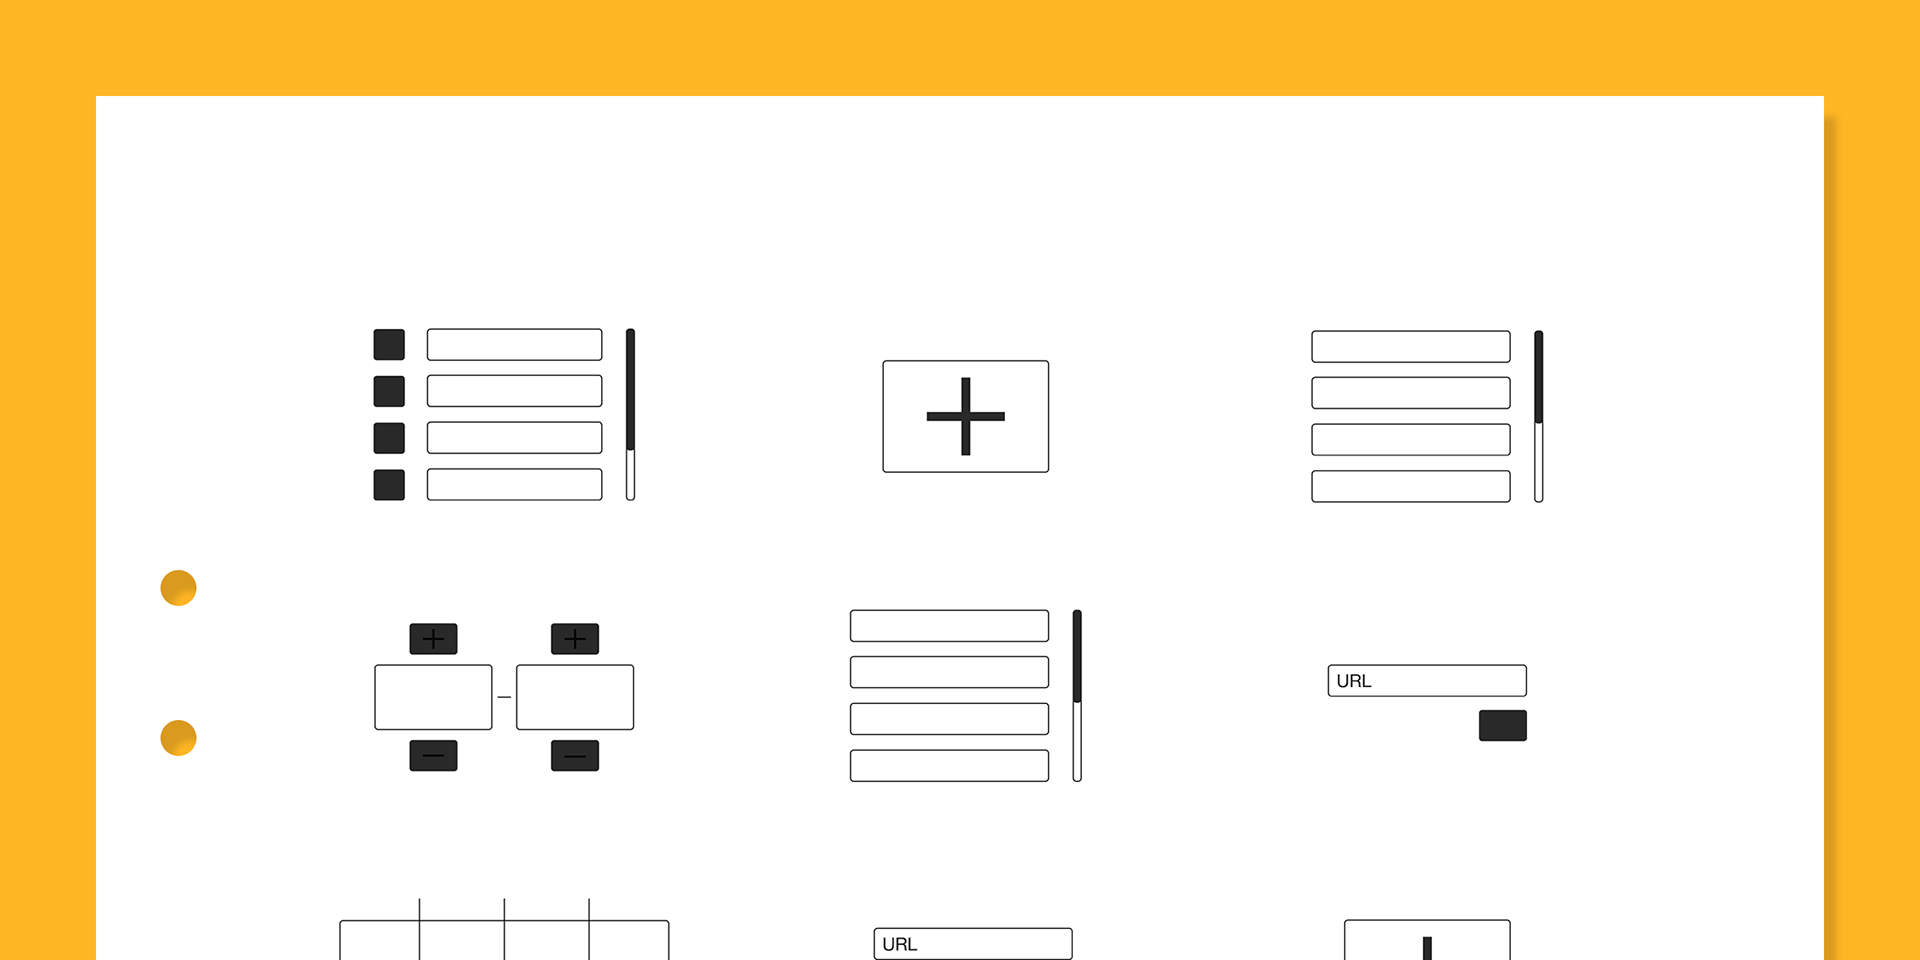
Components included in the focus group.
- prototype iterations
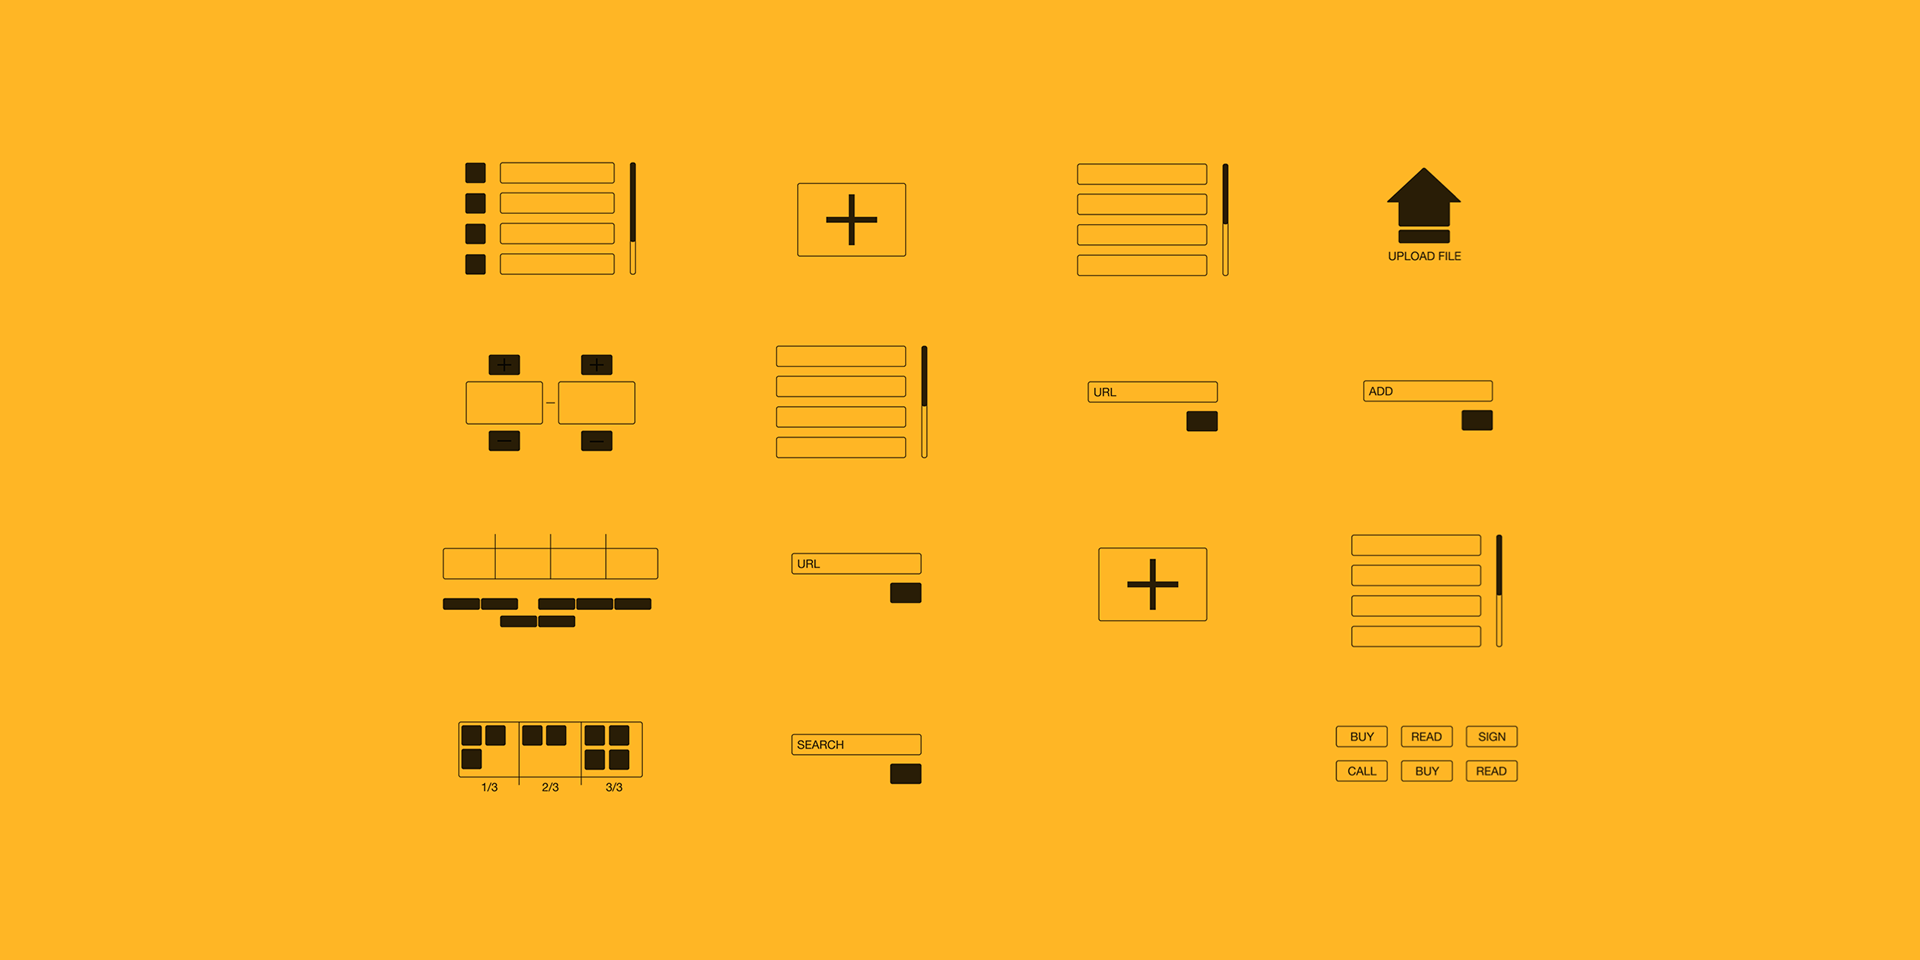
A wireframe prototype was constructed to investigate the overall structure of the interface and the placement of the components. This prototype was thereafter refined in three iterations, based on usability testings and feedback from experienced designers. At last, the final suggestion was designed on top of the prototype, to match the already set look of Smart Video.
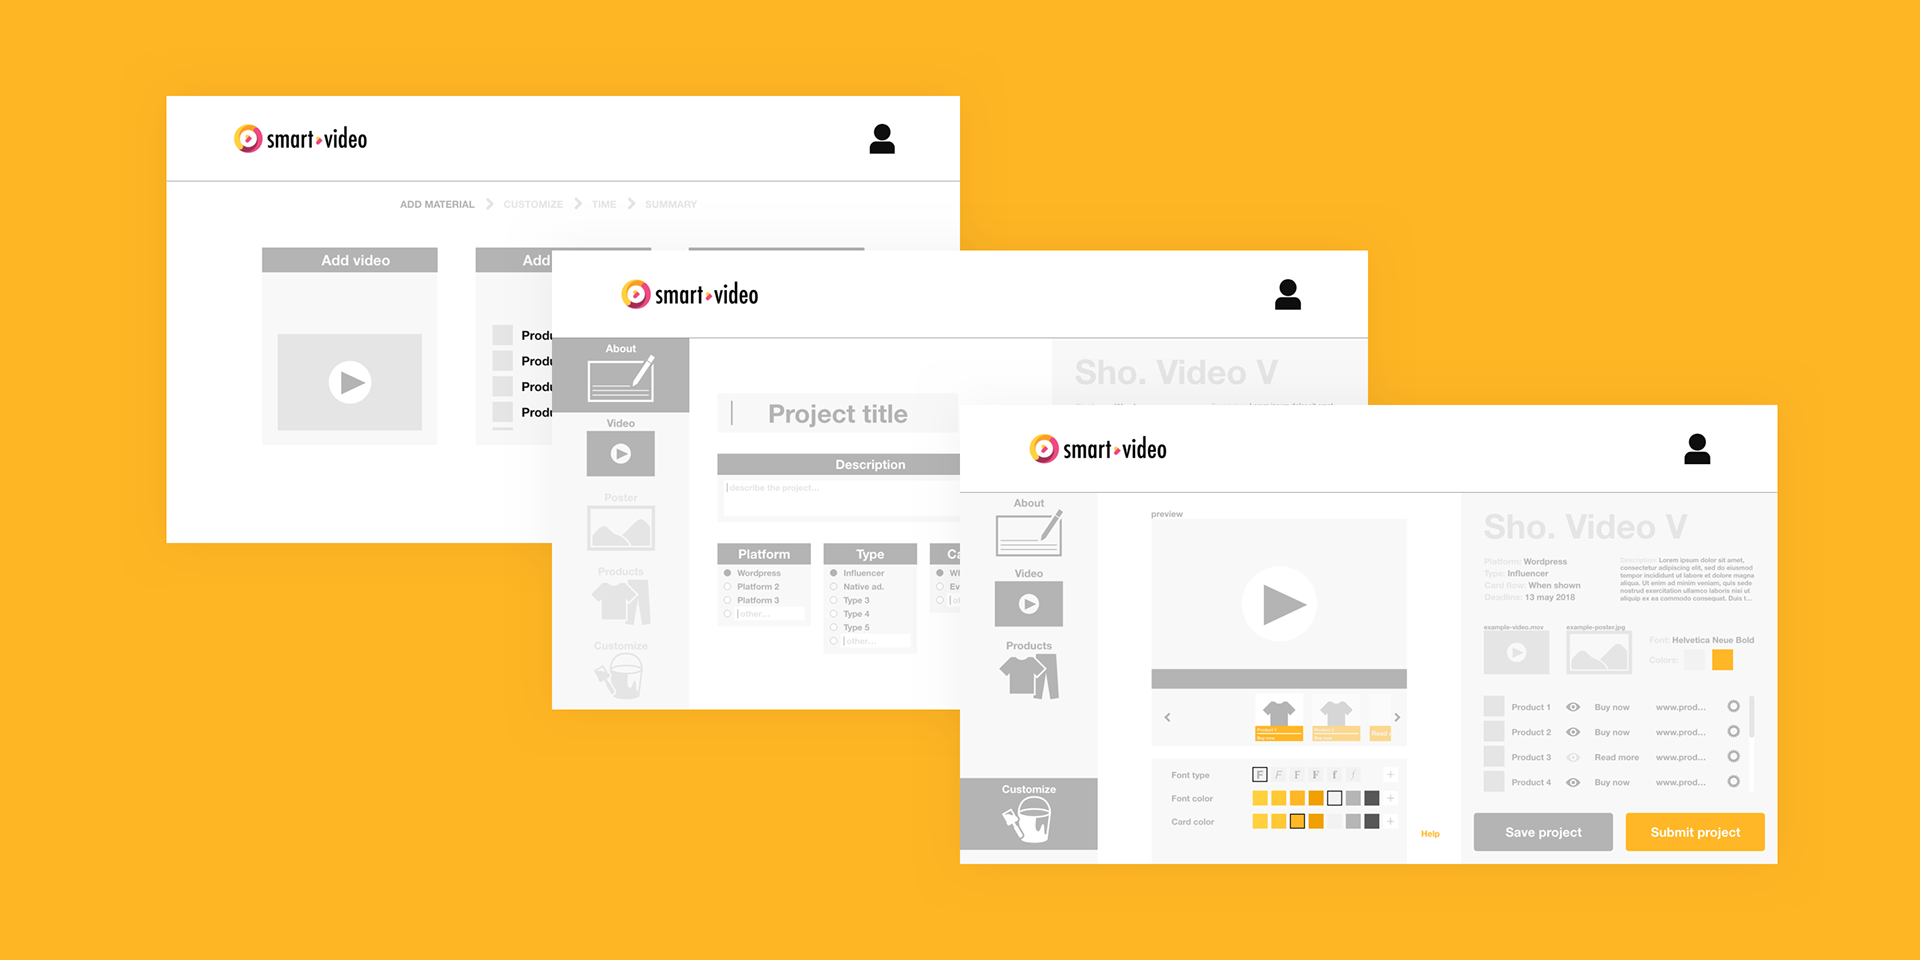
The prototype was iterated in three steps.
- create a new project
The process of creating a new project is built in steps that can be navigated in the vertical bar on the left. The user starts in About by describing the project in short terms to tell the operator how the final result expects to turn out and state some guidance in how to regulate the flow of cards. While all input is mirrored in the summary to the right as its being added for a better overview of the project.
Moving on to the following steps, the user provides the operator with the video and the products that are going in the shoppable video, before customizing the look of the cards to fit the context of the end product.
Moving on to the following steps, the user provides the operator with the video and the products that are going in the shoppable video, before customizing the look of the cards to fit the context of the end product.
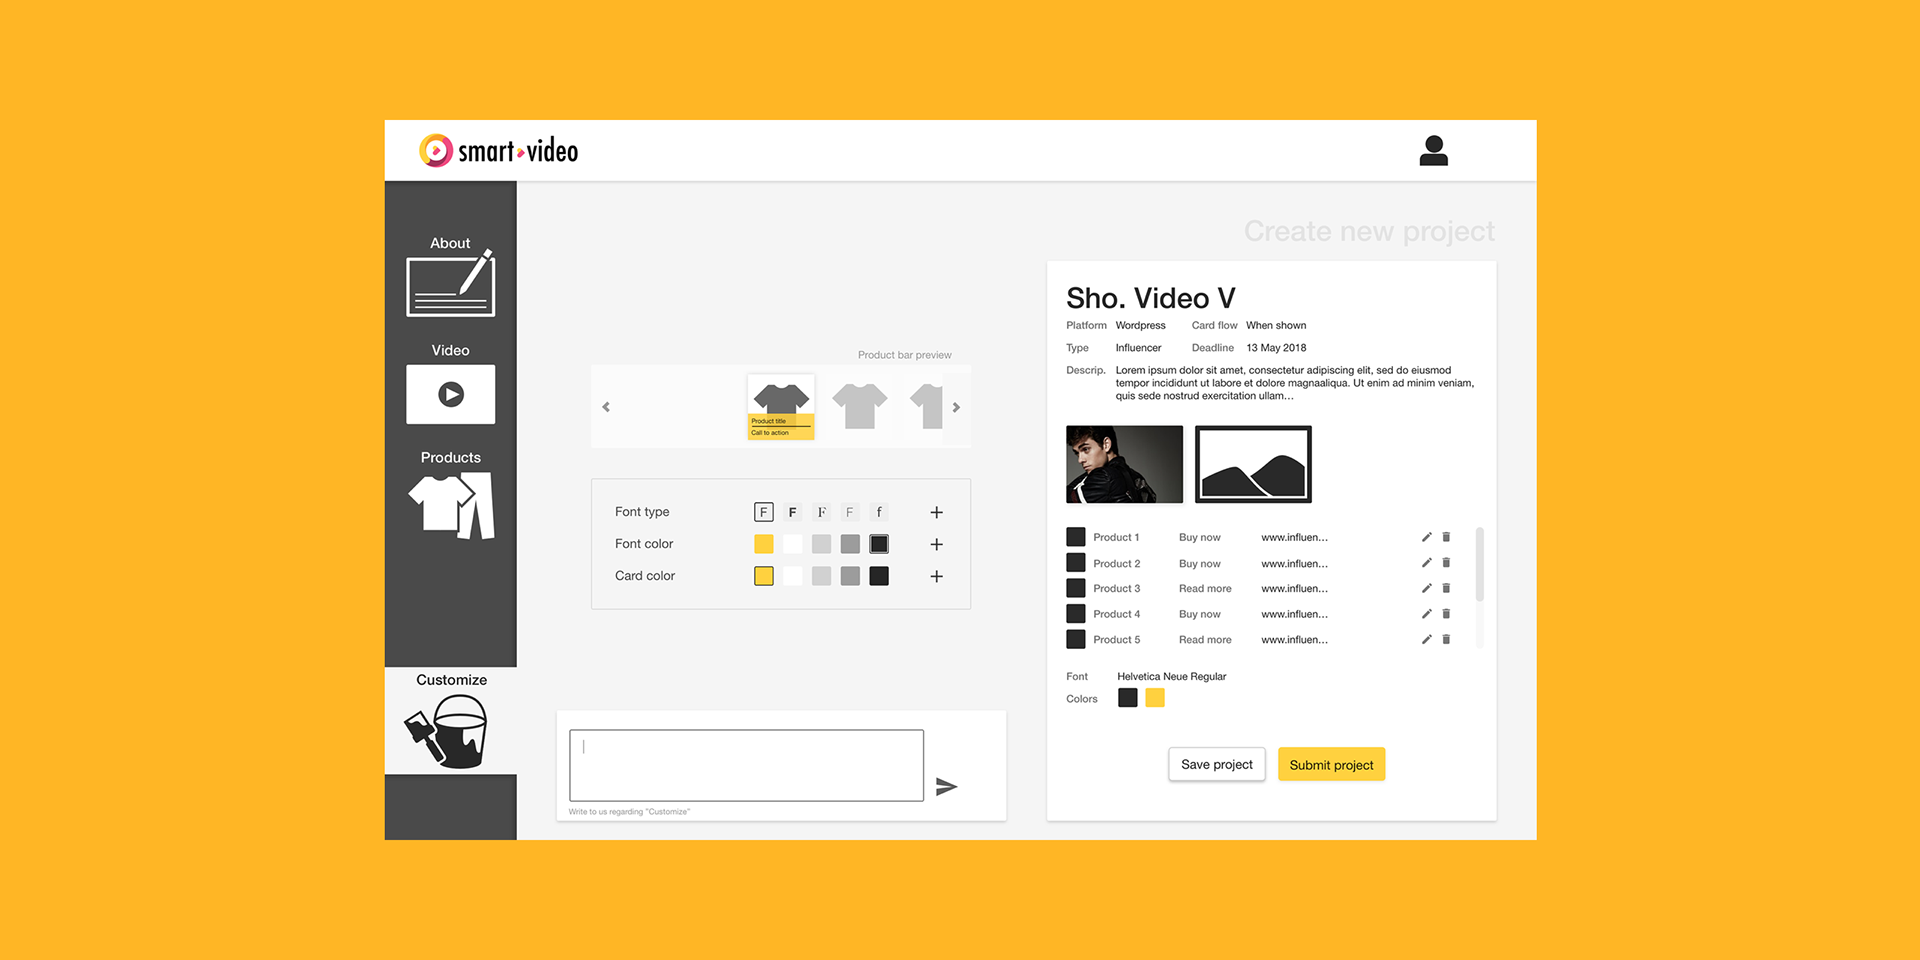
The customize-step when creating a new project.
- follow-up
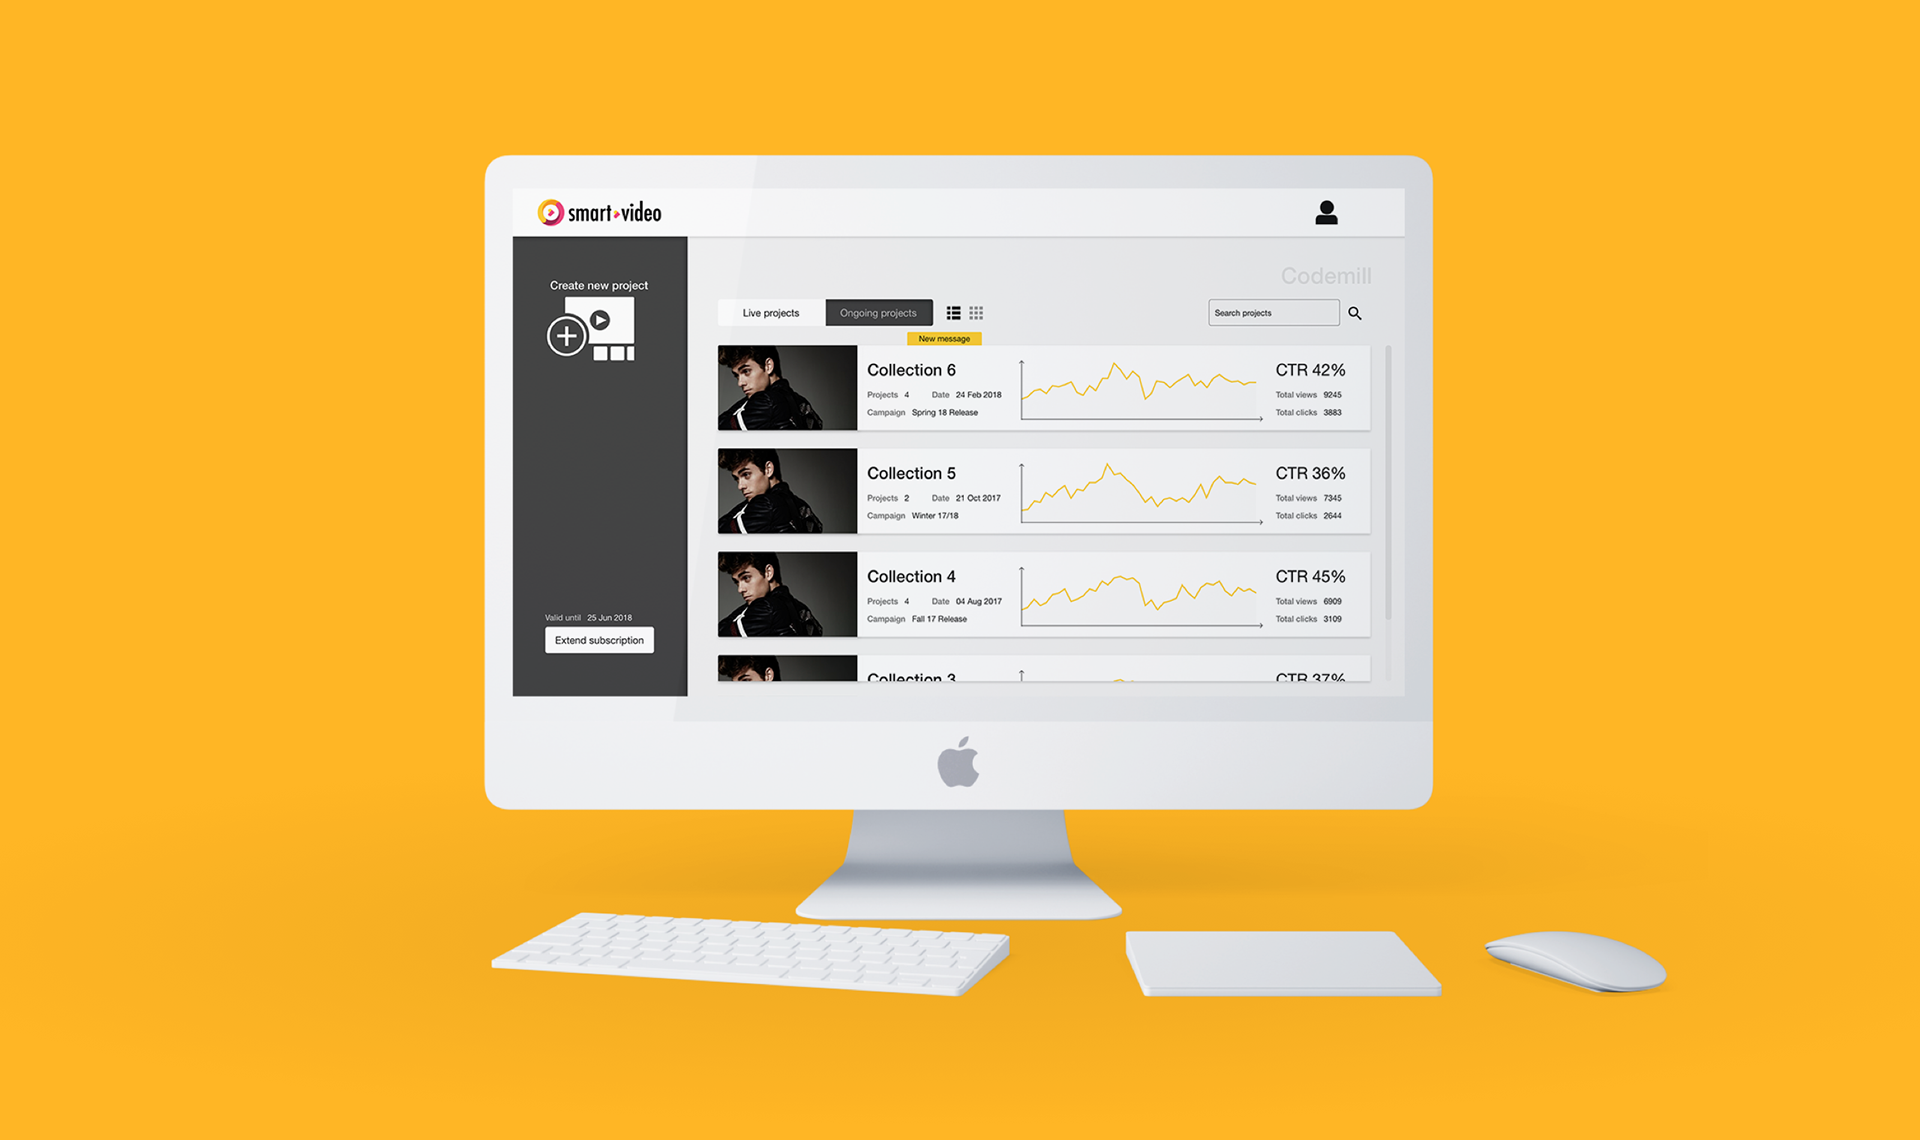
Although it’s possible to get a quick look of how a collection is performing on the home screen, in-depth data and statistics can be found by switching to the follow-up view in those project pages that carries a live project. From here, it’s possible to view a detailed dashboard on how the project is doing in terms of traffic.
The follow up presents the most usable data for the user to analyze, including CTR, total views, total clicks, device ratio, views per day, view completion and clicks per product. By changing display mode in the bottom right corner, it’s possible to see how a project has been doing for a certain time span and any data can be exported by clicking the PDF-button on the top of the dashboard.
The follow up presents the most usable data for the user to analyze, including CTR, total views, total clicks, device ratio, views per day, view completion and clicks per product. By changing display mode in the bottom right corner, it’s possible to see how a project has been doing for a certain time span and any data can be exported by clicking the PDF-button on the top of the dashboard.
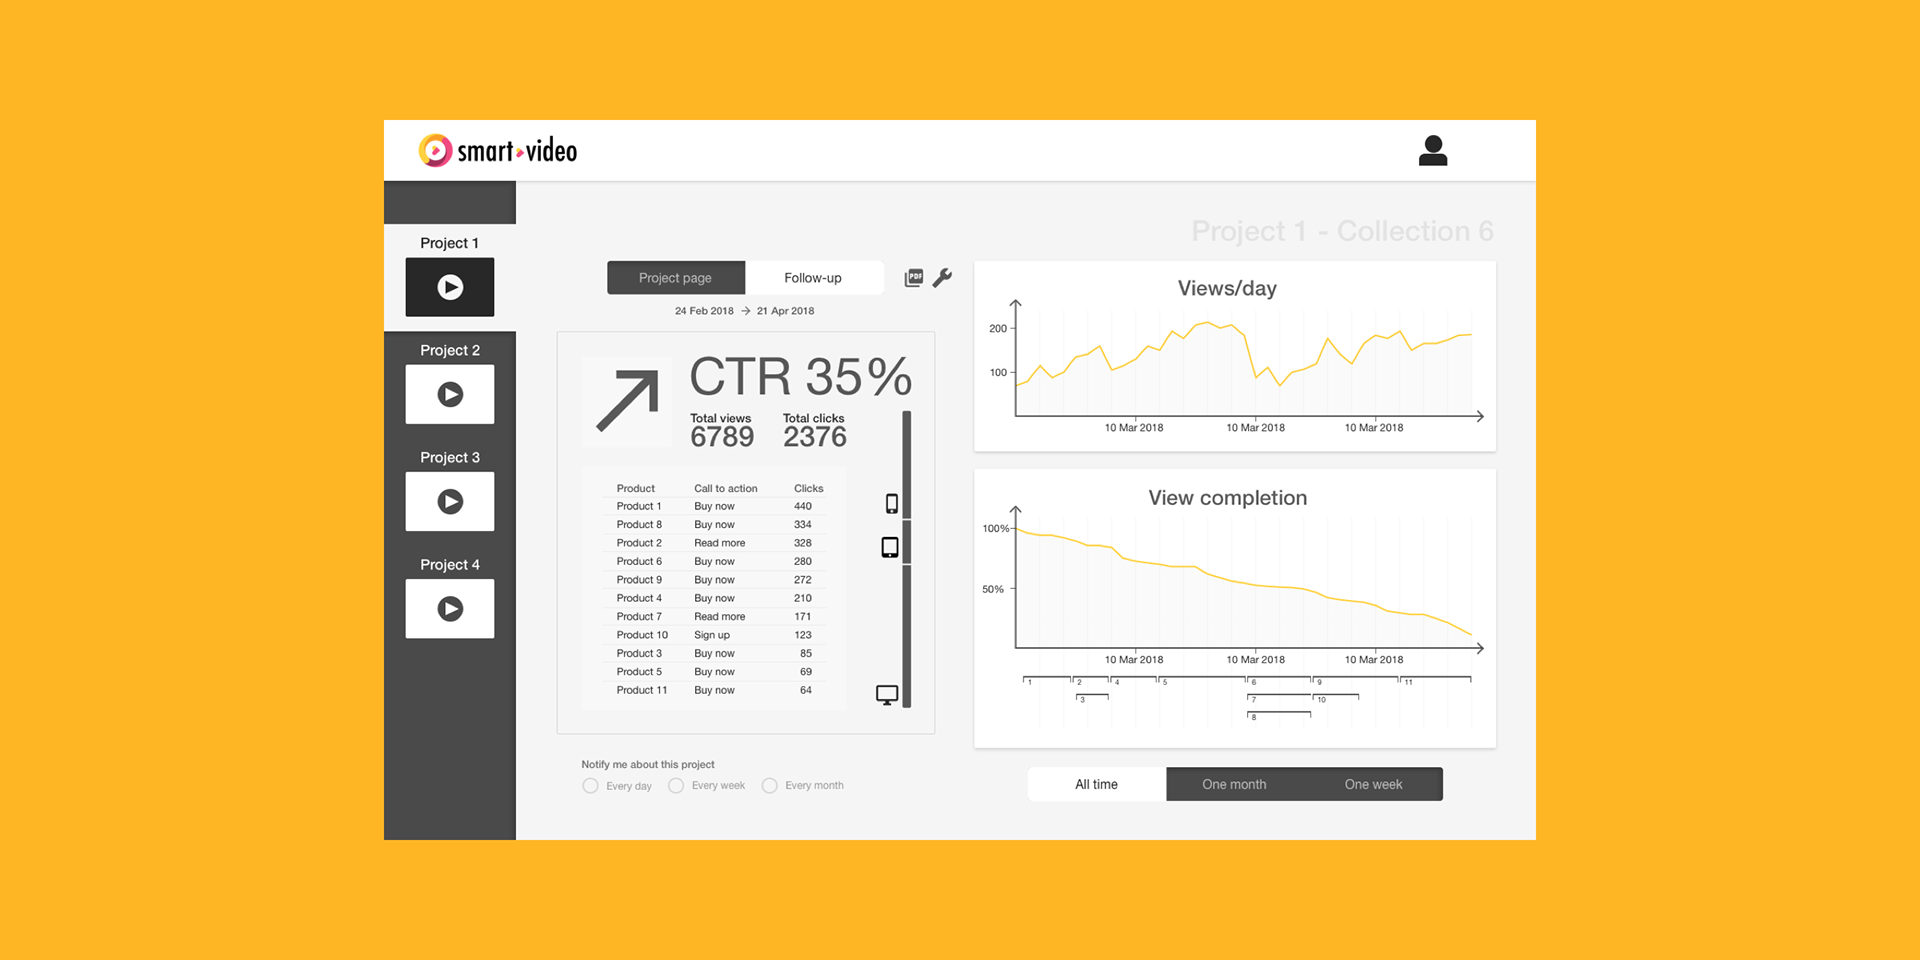
The follow-up page with project performance data.